Here at Givsum we’re constantly working to ensure you have the tools you need to successfully execute your campaign, outreach, and data tracking. Take a look below to see our two newest features, our Summary page and Analytics page, and how they make it easier to be a force for good!
Summary Page
The summary page keeps all of your campaign information in one place for quick and easy retrieval. You can access the page from the admin’s tool dropdown or on the admin dashboard.
The five different tabs organize your data in clearly marked ways to keep your desktop clean and organized. Each tab (except the invoice tab) includes CSV download and print buttons, as well as access to totals, donor lists, and receipt summaries.
- Donations- easily track and manage all donors and donations. Also, donations can now be accepted from anywhere in the world!
- Volunteers- monitor all volunteer shifts and roles as well as accept or waitlist volunteers.
- Tickets- track ticket sales, sponsorship levels, and quantities sold.
- Items- manage the sale of all items (raffle tickets, t-shirts, etc.).
- Invoices- track ticket and sponsorship invoices. You can also save time and get funds faster with automation.
Still a bit lost? Don’t worry! Everything is summarized in the Total Raised Tab (up in the top right!). From here, you can quickly send emails, print information, and download the numbers for review or sharing. This new page lets you spend less time worrying about keeping track of information and more time engaging with your supporters!
Analytics Page
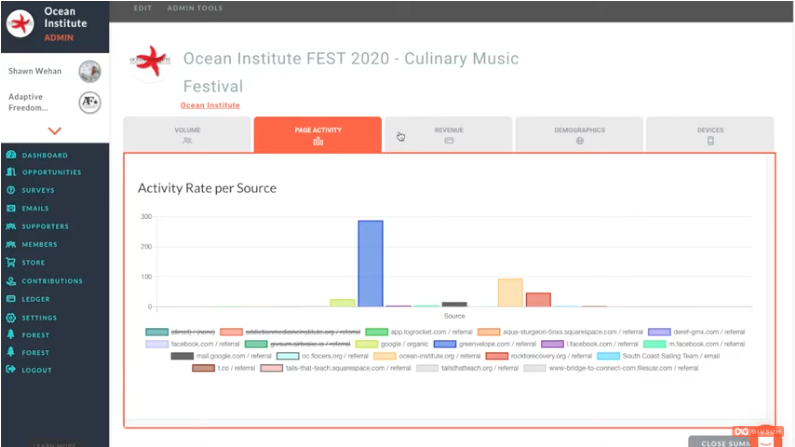
The new analytics page provides you with insights about how your users are engaging with your opportunities. You can access the page from the admin’s tool dropdown or on the admin dashboard
The five different tabs provide unique data points to help you better understand the online behavior of your users.
- Volume Tab- measures traffic to your opportunity page from links on other sights (social media, search engines, email newsletters, etc.) to inform you which sights are providing you with the most positive traffic
- Page Activity Tab- measures the total number of actions that occur once a supporter arrives on your opportunity page
- Revenue Tab- measures daily, monthly, and annual transactions (like purchases and donations) coming in to your opportunity. Over time, this will help you learn which marketing ideas launched on certain days generate the most revenue growth
- Demographics Tab- measures the breakdown of direct link service providers and general supporter locations to help you understand where your support is coming from in the world
- Devices Tab- measures what types of devices your supporters use, giving you info on how they engage with the Internet and, more specifically, your organization
This new page provides a centralized place to find information about your supporters to help you better engage with them.

